NYNYSM Growth under Bailey |
NYNYSM Growth

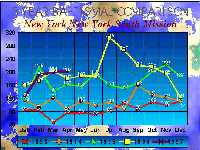
This graph shows the baptismal totals (per month) for 1993-1997. Click on the graph to view a larger version.

This graph shows the improvement in annual baptismal totals for each year.
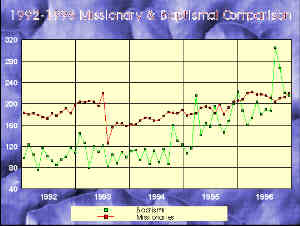
This graph shows the ratio of baptisms per missionary for 1992-1996. This is particularly important, because when the green and red lines cross, there is more than one baptism per missionary, per month. This level of productivity is particularly hard to achieve.

This shows the methods of finding as a percentage of the monthly baptismal total for 1996. Notice that the most productive areas are the efforts of the missionaries, and "Lacing".
Lacing refers to receiving referrals from members or new converts. The media referrals, or self-referred contacts were never responsible for any record breaking months. If a missionary relies on those finding methods, true success will never be had!

Click the chart to see how the New York South Mission compared with its neighboring missions.
|
|